Dashboard Overview
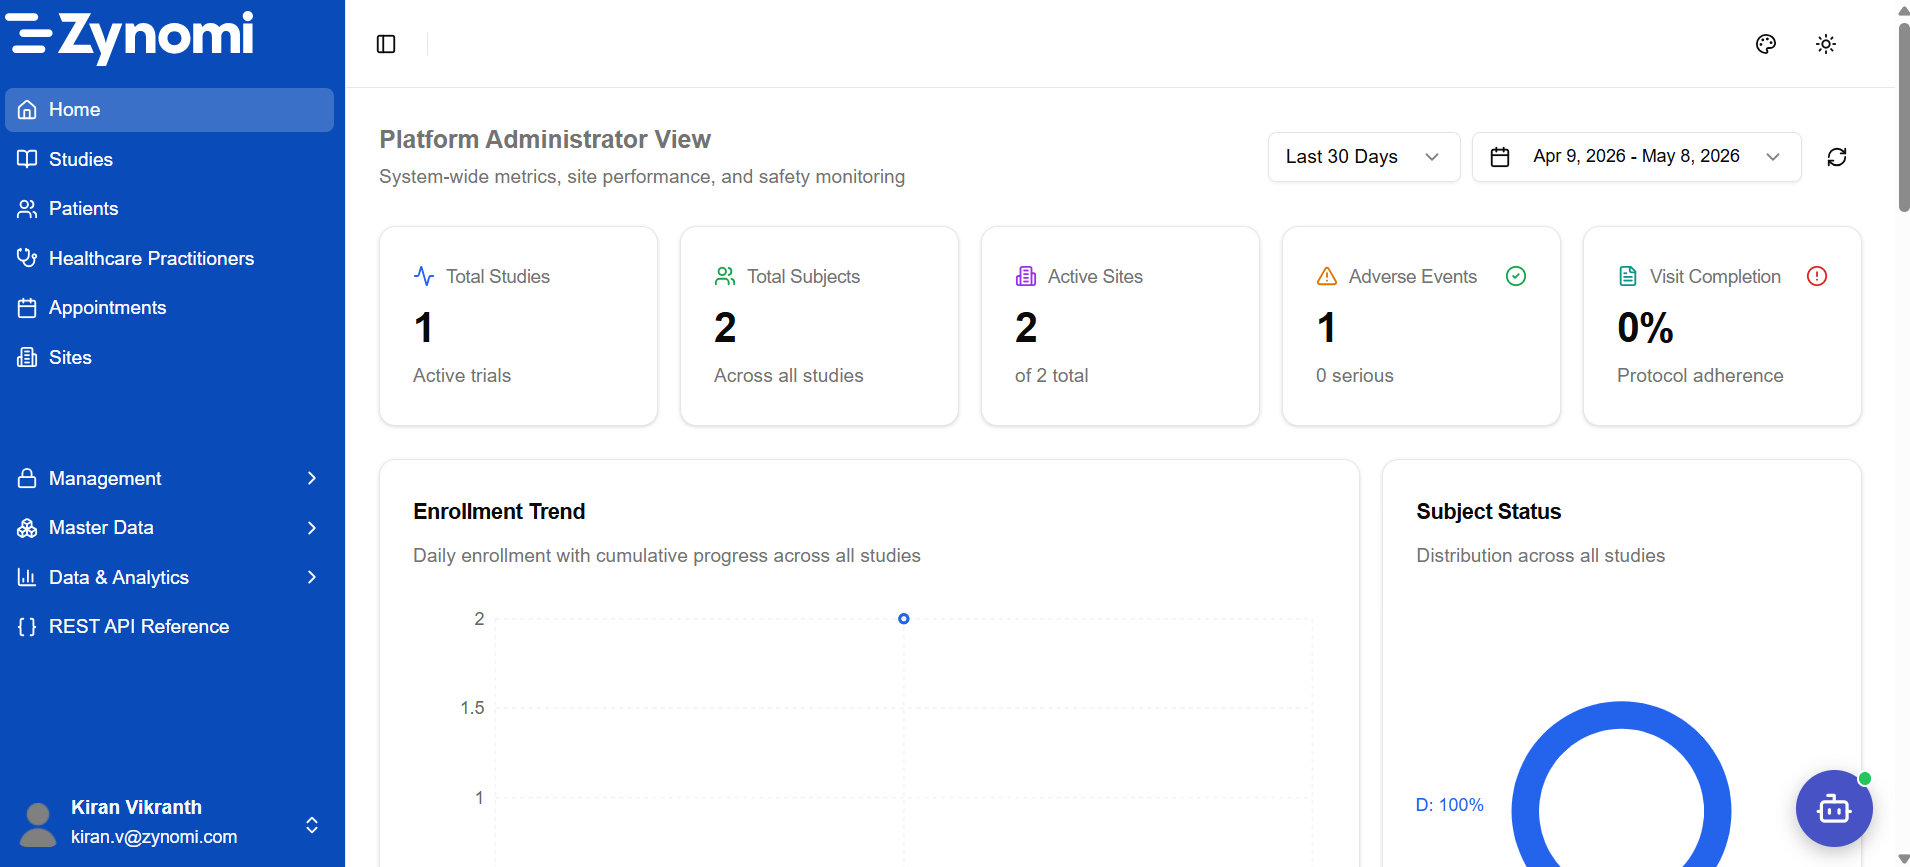
The Home dashboard is the first screen you see after logging in. It provides a real-time summary of your clinical trial programme across all studies and sites.
The dashboard header reflects your role. Platform Administrators see system-wide metrics across all studies. Study Coordinators and Principal Investigators see data scoped to their assigned studies.
Main Dashboard
The dashboard displays five KPI cards at the top, followed by trend and distribution charts.
KPI Cards
| Card | Description |
|---|---|
| Total Studies | Number of active clinical trials. Sub-label: Active trials |
| Total Subjects | Enrolled participants across all studies. Sub-label: Across all studies |
| Active Sites | Sites currently conducting the trial. Shows active count vs total |
| Adverse Events | Total adverse events recorded. Sub-label shows serious count separately |
| Visit Completion | Protocol adherence as a percentage. Tracks completed vs scheduled visits |
Date Range Filter
Use the Last 30 Days dropdown (top right of the KPI section) to change the reporting window. You can also set a custom date range using the calendar picker beside it.
Charts
| Chart | What it shows |
|---|---|
| Enrollment Trend | Daily enrollment with cumulative progress line across all studies |
| Subject Status | Donut chart showing the distribution of subjects by status (Active, Withdrawn, Completed, etc.) |
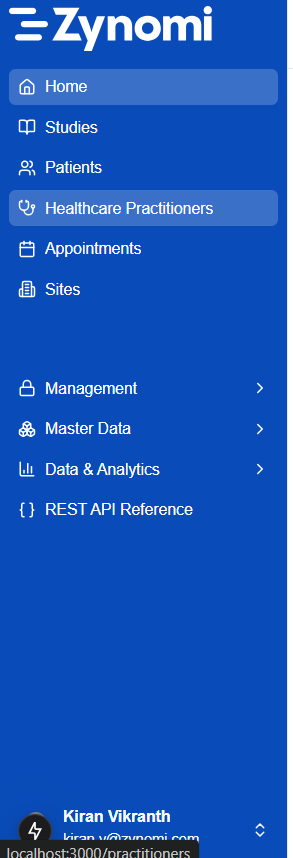
Sidebar Navigation
The left sidebar provides access to all modules in the application.
Navigation Sections
| Section | Purpose |
|---|---|
| Home | Dashboard overview (this page) |
| Studies | Create and manage clinical studies |
| Patients | Patient registry — add and manage patient profiles |
| Healthcare Practitioners | Manage practitioners linked to sites |
| Appointments | Schedule and view patient appointments |
| Sites | Manage trial site configurations |
| Management (expandable) | User management, roles, permissions, navigation settings |
| Master Data (expandable) | Reference data — diagnosis codes, medications, lab ranges |
| Data & Analytics (expandable) | Analytics dashboards, AI assistant, CDISC exports |
| REST API Reference | In-app API documentation |
Sections marked with a › arrow expand into sub-pages. Your sidebar will only show sections relevant to your role — some items are hidden for roles that don't have access.
Collapsing the Sidebar
Click the sidebar toggle icon (top-left of the main content area, next to the breadcrumb) to collapse the sidebar and gain more screen space for data entry.
Quick Reference
| Goal | Where to go |
|---|---|
| See all studies | Studies in the sidebar |
| Add a patient | Patients → Add Patient |
| View subject data | Studies → [Study] → Subjects → [Subject] |
| Configure users | Management → Users |
| View analytics | Data & Analytics → Dashboards |